Mobility data platform Vianova has found that 89 days of harsh braking data can match the predictive power of 430 days of historical collisions data.
In a new study, Vianova analysed three months of harsh braking data from connected vehicles and five years of historic collision data to compare the quality of predicting road collisions that comes from each approach.
The purpose of using connected vehicle data is to determine if safety interventions can be implemented before collisions have happened, rather than implementing these interventions after collisions have occurred.
“Essentially, identifying problem spots or evaluating improvements can be done much faster, and without the worst-case scenario of a collision needing to occur,” Vianova Data Scientist Anne Legendre told Zag Daily. “When most black spot analyses use a minimum three years of data to identify risk zones, getting the same insights in a much smaller time period could really change the paradigm.”
To come to its findings, Vianova studied data in central London. The company built a model which incorporated five years of historic collision data, three months of harsh braking data, and a nine-month validation dataset of collisions.
Its purpose was to determine how many of the data points in the validation set could be identified using historic collision data and harsh braking data.
Using a clustering algorithm, Vianova identified 2,031 cluster centroids which were considered as distinct risk locations as a result of multiple vehicles suddenly braking. Each cluster represents a 75-metre radius.
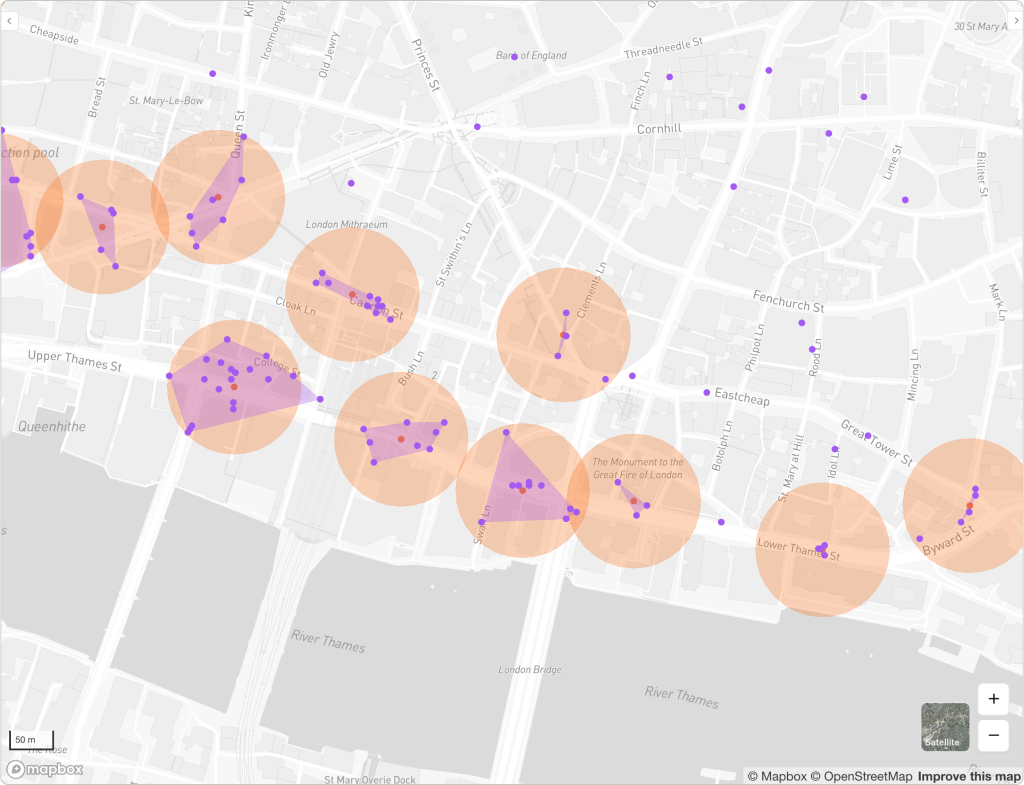
These clusters were then compared against the 6,624 actual collisions that were recorded in the following nine months.
This model’s performance was compared against two models based on five years of historic collision data. The first compared a random sample of 2,031 collisions, and the second analysed the entire set of collisions in the last five years.
Vianova found that 39% of future collisions occurred within 75 metres of its identified harsh braking clusters. And the approach was 35% more accurate than selecting an equivalent sample from historical collision data.
“Our approach is part of a shift from reactive to proactive safety planning,” said Anne. “We’re not disputing the strong predictive power of historic collisions to spot future collisions. But if the same trends are apparent in a few weeks of data, then it’s much easier to deploy low cost interventions like signs and lines rather than waiting for something awful to happen.
“And getting new data daily or even hourly can dramatically shorten the feedback loop to figure out if an intervention is having the desired effect, or if there are negative impacts somewhere else.”
When expanding its analysis to compare the predictive effects of a grouping of harsh braking events versus a grouping of collisions, Vianova found that harsh braking data alone achieved a 71.83% prediction rate.
A combination of both harsh braking patterns and historical collisions meant Vianova could predict 93.80% of its standardised areas with future collisions.
138 of these standardised areas – which were hexagonal areas for the purpose of the study – had no historic collision record but showed harsh braking patterns. Vianova found these areas to then go on and experience future collisions, which would have been missed if only using traditional analyses methods.
Furthermore, Vianova found that single harsh braking clusters often predicted multiple future collision locations. This suggests that these areas represent a persistent risk rather than random incidents, flagging them for intervention.
“We’re continuing to work with cities throughout Europe to refine the model and look at the predictive power of other behavioral insights from Floating Car Data, such as speeding. We’re also expanding the research to test in different geographic and cultural contexts, such as the US.”