Author: Adam Tarshis, Business Development Director, Anadue
Many CEO’s proudly say that their employees are their biggest asset, but in reality, it’s a company’s customer base that provides the life-blood that sustains activity and enables growth. And while most companies have a Human Resources department to recruit and retain employees, few have a dedicated team looking into the needs and behaviours of their customers.
At Anadue we have analysed anonymous data from multiple shared micromobility operators across multiple cities, over many months, to better understand customer behaviour and sentiment. It’s important to note that these findings might not apply to every customer base. Cultural, demographic and economic differences between cities and countries could mean other customers behave very differently.
Frequency of rides
If you imagine that a typical rider is commuting twice a day on a shared vehicle, you might be surprised. Our analysis shows that the vast majority of customers only take fewer than three rides each month.
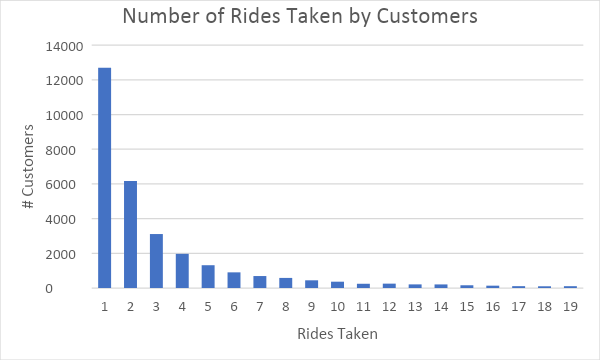
The above chart doesn’t include customers that didn’t take any trips that month. For an operator to be successful, it needs a huge pool of registered customers that take rides when (very occasionally) it’s their preferred method of transport. Special promotions that increase the revenue from existing low-usage customers have huge potential to affect the bottom line.
This also highlights the importance of high-spending customers. The very rare customers that regularly take +60 trips per month are each worth the same as hundreds of “average” customers. Retaining these high-spending customers should be a top priority.
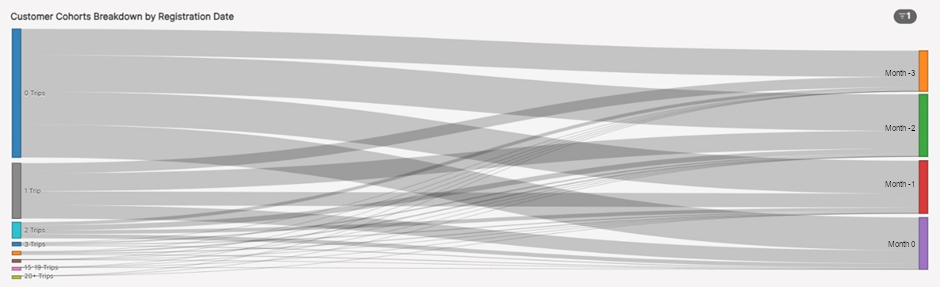
You might think that it’s just a matter of time before a new customer takes their first (and second) trip, but our analysis says otherwise. The percentage of customers taking zero trips is almost the same whether that customer registered one, two, three or even four months ago. The percentage taking more trips is also barely affected by their registration date. So unless there is an incentive to increase usage, the behaviour of a cohort of customers is fixed over time.
Customer Acquisition
If we accept that operators need a dual strategy of building a huge pool of registered customers that take very few rides each month, plus the retention of the small percentage of high-spending customers, then how can this be achieved?
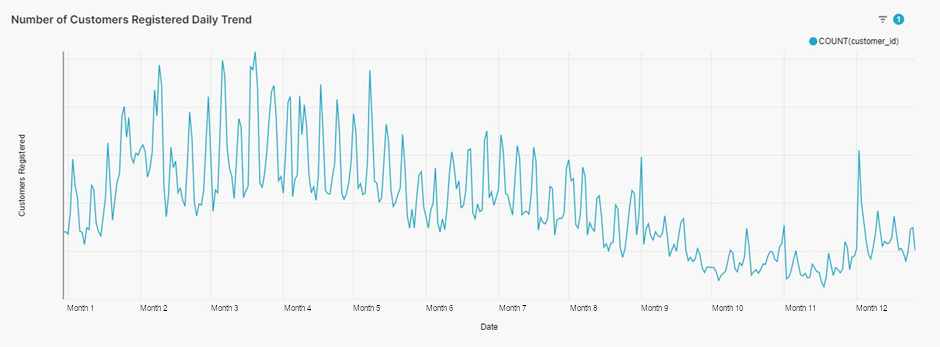
Throughout the year, there is a clear pattern of when people first register for a shared mobility service. Fridays and Saturdays are critical to capturing new customers. At these times, a fleet needs to be where people first decide that a shared vehicle is their best option. Our analysis shows that leisure locations in the afternoon and evenings are typically where most rides start on these days. Every city is different, but Location Intelligence can pinpoint the ideal locations where an operator will capture the most new customers.
Higher usage = higher satisfaction
It’s fairly easy to calculate an average customer satisfaction score by analysing the feedback left by customers at the end of each ride. There is a built-in bias that people are more likely to leave feedback when they are unhappy, and even more likely to leave feedback that includes a text comment if they are very unhappy.
Generally, a satisfied customer base should be scoring an average of around 4 out of 5.
If you break down customer feedback scores by the monthly number of rides taken, it is revealed that customers that only took a single ride in the last month are less satisfied than more frequent users.
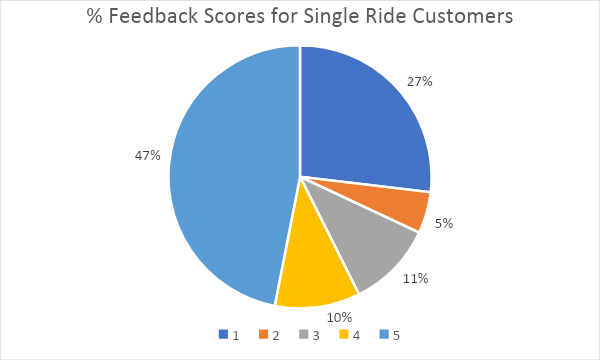
Of riders that only took one ride in the last month, 27% gave that ride 1 out of 5 stars. Maybe that’s the reason they only took one ride!
What makes riders unhappy? This varies widely by city. The most frequent complaints relate to difficulties parking, problems with vehicles and the price. Increasing customer satisfaction needs targeted action based on the issues being reported in each location.
Seasonality
An operator might assume that it knows how shared mobility riders behave and how it varies by season, and most of the time it is probably right, but there might be nuggets of valuable information that optimise how a fleet is deployed and the workforce scaled.
In Europe, it is predictable that there are more rides in the summer than the winter, but drill down into the details and our findings show that in the winter, although the number of rides falls, the average distance travelled per ride increases in some towns.
It can also be seen that the mix of new customers and experienced customers varies far more in coastal towns. In the summer, in coastal towns, only 5.5% of trips are taken by long-term customers, but in the winter this rises to over 14%. It’s likely that people that live in coastal towns take longer trips than tourists, so the secret to surviving a winter by the sea is to cut costs to match reduced demand, while keeping the locals happy. We found far less seasonal change in the makeup of customers for inland cities.
Conclusion
The above analysis is generic, combining data from multiple shared micromobility operators across many cities and countries. Building a profitable business needs an understanding of the customers’ behaviour and sentiment. Then you can take steps to attract and retain more customers and encourage existing customers to take more trips.
Customer Analytics is rarely given the priority it deserves, but it is crucial to knowing where management attention should be focused to grow and succeed.